Introduction
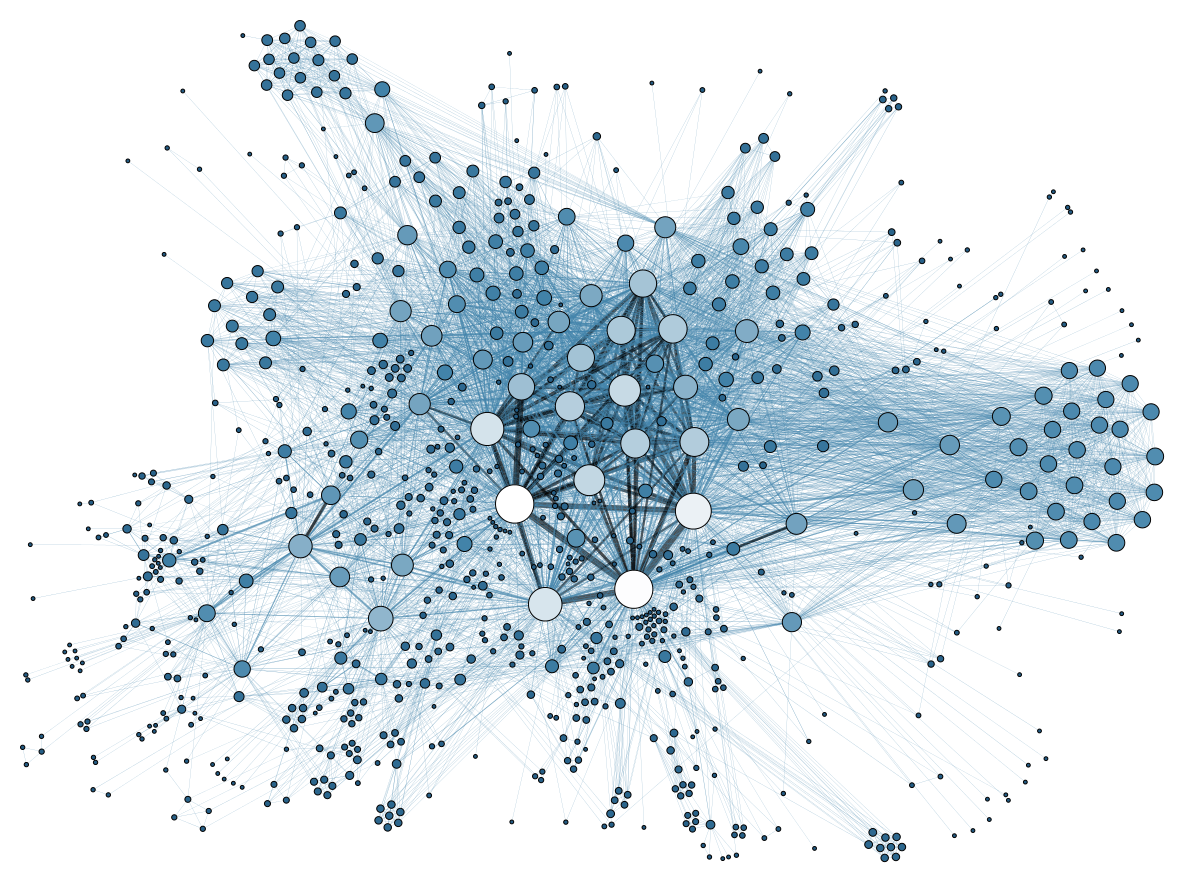
For the ending of college, I had a mission to create a final paper in my course. For that task, I decided to use my ongoing research on Ethereum, which involved data exploration and analysis on the Ethereum blockchain. Because of the nature of Ethereum being essentially a network, I decided to model it as a graph, or more specifically: as a complex network.
What is a Graph?
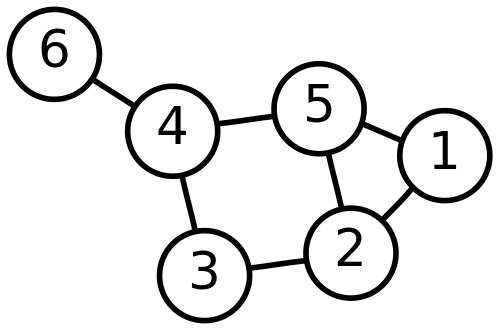
A graph is a mathematical representation of a set of objects, called nodes or vertices, that are connected by links known as edges. In the context of a network like Ethereum, the nodes can represent accounts or addresses, and the edges can represent transactions or interactions between these accounts. Graphs can be used to model many types of relationships and structures, making them a powerful tool for analyzing complex systems.
Network Metrics in My Final Paper
For my final paper, I calculated some network metrics to analyze the Ethereum network. Two important metrics I focused on were clustering and assortativity.
Clustering: This metric measures the degree to which nodes in a graph tend to cluster together. In a social network, for instance, it indicates how likely it is that two friends of a person are also friends with each other. In the Ethereum network, high clustering could indicate groups of accounts that frequently interact with each other.
Assortativity: This metric measures the tendency of nodes to connect with other nodes that are similar in some way. In the context of Ethereum, assortativity could reveal whether accounts with similar transaction volumes or balances tend to interact more with each other.
Node-Specific Metrics: Centrality
I also calculated some metrics specific to the nodes, particularly their centrality. Centrality measures the importance or influence of a node within the network. There are several types of centrality, but in my research, I focused on identifying central accounts in Ethereum for specific events. This involved determining which accounts were most pivotal in facilitating transactions or acting as hubs in the network.
Conclusions of Paper
By the use of these metrics, I was able to engineer more features in our datasets, for multiple timeframes of our collection period. With these new features, some things could be understood about this crypto ecosystem:
The tendency of formation of large and strong central groups is extremely low. This corroborates with blockchain’s decentralization ideology.
Big exchanges and NFT negotiation accounts were found as most impactful (central) addresses.
Network characteristics change over time, instead of having large fluctuations within important events, like a pandemic or the upbringing of an impactful armed conflict.
These findings serve as an important basis to understand the nature of such a chaotic ecosystem.
Broader Implications: Network Modeling in Data Science
Through this project, I learned how the use of network modeling can be useful for other day-to-day data science problems. Network modeling provides a unique perspective by highlighting relationships and interactions within data, which is not always apparent through traditional analysis methods.
Future works?
I thought about the possible application of this theory in other uses for data science. Here are some thoughts:
Social Network Analysis: By modeling social media interactions as a network, we could identify influential users, detect communities, and analyze the spread of information or trends.
Recommendation Systems: E-commerce platforms and streaming services can make use of network modeling to recommend products or content to users based on the relationships and interactions between items and users. I have some more thoughts about this application, I will bring in another separate post.
Fraud Detection: Financial institutions could model their activities in a similar way as I modeled Ethereum. Fraud detection is commonly made with complex networks in Ethereum, so it wouldn’t be absurd to think about using it in a traditional financial context.
Infrastructure Optimization: This is a classical application of graph theory. Utility companies can optimize the maintenance and expansion of infrastructure, such as power grids or water supply networks, by identifying critical points that could impact the entire system.